


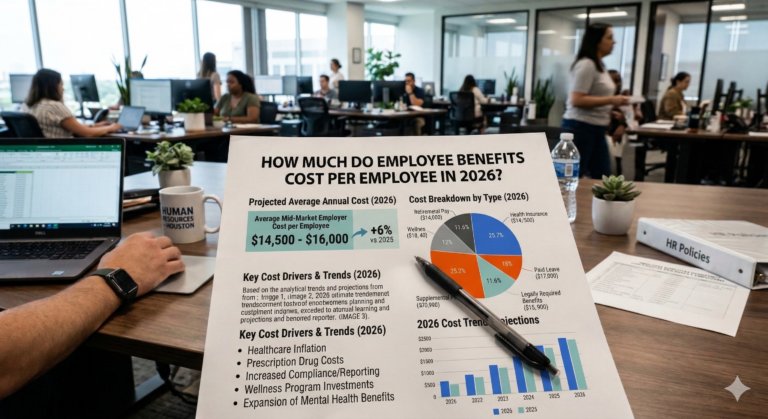
Employee benefits cost U.S. private employers an average of $14.07 per hour worked, or 30.0% of total compensation, according to the Bureau of Labor Statistics’ June 2026 Employer Costs for Employee Compensation release. For a full-time worker the figure is $17.03 per hour, about $35,400 a year at 2,080 hours. Health insurance is the largest single piece: the average employer-sponsored premium was $9,325 for single coverage and $26,993 for family coverage in 2025, per KFF’s Employer Health Benefits Survey.
Key Cost Benchmarks for Mid-Market Employers
- Benefits are 30.0% of total compensation in private industry (BLS, June 2026), or 31.5% for full-time workers. That equals roughly 43 cents in benefits for every dollar of wages.
- Employers pay about $7,885 a year for single health coverage and $20,143 for family coverage, after worker contributions of $1,440 and $6,850 (KFF, 2025).
- Mid-market employers absorbed the 2023–2025 cost increases more often than small businesses — large groups kept deductibles flat while smaller groups raised cost-sharing to offset 6–7% annual premium inflation.
- The employer/employee premium split: workers paid an average of 16% of the single premium and 26% of the family premium in 2025 (KFF). Plans vary widely by company size and industry.
- 401(k) matching adds 2–5% of payroll to total compensation costs — an often-underestimated variable in total benefits budget planning.
How Much Do Benefits Cost Per Employee in 2026?
The most-cited national figure comes from the BLS. Private employers spent $14.07 per hour worked on benefits in June 2026, and the cost runs far higher for full-time staff than for part-time staff.
| Private industry, June 2026 | Benefits per hour | Share of compensation | Annual at 2,080 hrs |
|---|---|---|---|
| All workers | $14.07 | 30.0% | ~$29,300 |
| Full-time workers | $17.03 | 31.5% | ~$35,400 |
| Part-time workers | $5.05 | 20.0% | n/a |
| South region (incl. Texas) | $11.88 | 28.4% | ~$24,700 |
Source: U.S. Bureau of Labor Statistics, Employer Costs for Employee Compensation, June 2026. Annual figures multiply the hourly cost by 2,080 hours and are approximate. Benefits include paid leave, insurance, retirement and legally required payroll taxes.
Within that total, full-time workers’ paid leave cost $4.40 an hour and legally required benefits such as Social Security, Medicare and unemployment insurance cost $3.76 an hour. Health insurance is the line that moves the most from one company to the next.
| Health coverage, 2025 | Total premium | Worker pays | Employer pays |
|---|---|---|---|
| Single | $9,325 | $1,440 | $7,885 |
| Family | $26,993 | $6,850 | $20,143 |
Source: KFF 2025 Employer Health Benefits Survey, firms with 10 or more workers. Employer share is the premium minus the average worker contribution.
Every time a CFO builds a headcount model, the benefits cost assumption drives the number. Get it wrong and you’re either under-budgeting by six figures or padding the model with phantom costs that kill a hire. The problem is that “average benefits cost per employee” statistics are almost meaningless without the company size, industry, and geographic context that makes them comparable to your specific situation.
Dental coverage is a core component of most benefits packages, and employees without coverage face significant out-of-pocket expenses — our analysis of dental cleaning costs without insurance shows routine cleanings averaging $75 to $350.
Our guide to supplemental life insurance for employers covers plan design, participation, and carrier benchmarks. For a broader perspective on the role benefits play in talent strategy, see our analysis of why employee benefits matter in today’s job market. Cleaning and janitorial companies have unique exposure — our commercial cleaning insurance guide covers GL, bonding, and employee dishonesty.
This guide breaks it down by company size, benefit category, and the structural decisions — plan design, employer contribution strategy, self-funding vs. fully insured — that actually drive what you spend. These are the numbers that matter for a mid-market employer with 100–500 employees managing a real benefits program.
How Does Your Benefits Spend Compare?
Hotaling’s advisors run independent cost benchmarking for mid-market employers before every renewal — comparing your total benefits spend against industry-specific peer data matched to your company size and geography.
Request a Cost Benchmarking ReviewThe 2026 Cost Trend Every CFO Is Budgeting Against
Before you benchmark your own number, anchor it to where the market is moving. Employer health benefit cost per employee is projected to rise 6.5%–6.7% in 2026 — the steepest increase in 15 years — and that figure is after planned cost-cutting. Absent any plan changes, the underlying trend runs closer to 9%. The 2027 outlook is steeper still, and our 2027 health benefits renewal playbook lays out what to start before carrier letters arrive. The major actuarial surveys cluster tightly:
- Mercer (2025 National Survey of Employer-Sponsored Health Plans): +6.5%–6.7%, average cost crossing $18,500 per employee in 2026.
- Business Group on Health: +7.6% | PwC: +8.5% medical trend (third straight year) | WTW: +9.1% gross | Aon: +9.5%, above $17,000 per employee.
- What’s driving it: GLP-1 / weight-loss drug utilization, catastrophic and chronic claims (WTW: 5% of members drive 56% of cost), cancer treatment cost, and provider consolidation.
The buyer response: 59% of employers are making cost-cutting plan changes for 2026 — up from 48% in 2025 and 44% in 2024 — mostly by raising deductibles, copays, and out-of-pocket maximums. The strategic question is no longer whether your spend rises, but whether you absorb it, shift it to employees, or restructure to bend the trend.
How Your Per-Employee Cost Compares by Profile
The same coverage produces very different per-employee costs depending on four levers. This is illustrative market-range positioning — not a quote — to show where a given employer profile tends to land relative to peers:
| Employer profile | Funding model | Relative per-employee cost | Primary cost driver |
|---|---|---|---|
| 100 employees, single-skewed census | Fully insured | Lower band | Limited carrier leverage; community-rated pooling |
| 250 employees, mixed family/single | Fully insured or level-funded | Mid band | Family-coverage election rate; geography |
| 250+, healthy/predictable claims | Self-funded + stop-loss | Lower effective cost, higher variance | Claims experience; stop-loss attachment |
| Any size, GLP-1 / specialty-heavy | Any | Upper band | Pharmacy trend; high-cost claimant concentration |
Bands are directional, peer-relative positions — not premium quotes. Actual cost depends on your census, claims history, plan design, and market. Hotaling’s advisors benchmark your specific number against industry- and size-matched peer data at renewal.
A Mid-Market Example: Where the Trend Actually Lands
Consider a 240-employee professional-services firm in the Northeast running a fully insured PPO with a family-skewed census. Going into 2026 renewal, the carrier’s first pass reflected the broad market trend — a high-single-digit increase — which would have pushed total per-employee cost well into the upper benchmark band. Rather than absorb it or simply raise the deductible across the board, the employer modeled three paths: pocket nothing and pass ~6–7% to employees through contributions, hold employee cost flat and absorb the trend, or restructure toward a level-funded arrangement with a narrow-network option layered in for price-sensitive employees. The restructuring path bent the effective trend by several points without gutting the benefit — the same move the surveys show 59% of employers now reaching for. The lesson is not the specific number; it is that the renewal increase is a decision variable, not a fixed cost.
What Is the Average Cost of Benefits Per Employee for Mid-Market Companies?
The BLS and Kaiser Family Foundation publish aggregate national averages — useful for context, not for budgeting. Here’s what the numbers actually look like for mid-market employers managing a competitive benefits program.
For a broader look at how these coverage considerations fit into a complete risk program, our guide on employee benefits broker guide for mid-market employers covers the full picture for organizations at this scale.
Health insurance (employer cost per employee per year):
CFOs benchmarking per-employee costs should also review how commercial health insurance works for mid-market employers for a structural overview of how group health plans are priced and administered.
Companies spending $500+ per employee on benefits administration overhead should evaluate outsourcing employee benefits administration as a way to reduce internal HR burden while maintaining compliance.
- Single coverage: The average employer share was $7,885 a year in 2025 (KFF). Employers with richer plans or older workforces pay more.
- Family coverage: The average employer share was $20,143 a year. Your blended cost depends on how many employees enroll family versus single.
- Company size: At 100 to 500 employees, larger groups gain underwriting credibility, and level-funding or self-funding becomes realistic for groups with favorable claims.
Why these ranges are wide: Health insurance cost per employee is the product of plan design (deductible, network tier, out-of-pocket maximum), workforce demographics (age distribution, dependent enrollment rate, claims history), geography (Texas generally cheaper than California or New York), and employer contribution strategy. A company paying 85% of family premium has dramatically different per-employee cost than one paying 60%, even if they’re on the same carrier plan.
What Does Each Employee Benefit Cost?
Total benefits cost is the sum of multiple lines. CFOs building headcount models need each line separately — the health insurance budget and the retirement budget are managed differently, and collapsing them into a single percentage of payroll obscures where the real variability lives.
Health insurance: The dominant variable. For a mid-market employer on a fully insured plan, the KFF averages work out to about $657 a month per employee for single coverage and $1,679 a month for family coverage in employer cost. The specific number depends on plan tier, network, and the split you’ve structured. The employer’s contribution to family-tier coverage is where most of the cost concentration lives — most of your higher earners are on family plans.
Dental and vision: Dental and vision are small lines next to medical — but they show up in benchmarking comparisons and matter to employees more than the cost would suggest. Employees without strong dental coverage face significant out-of-pocket costs — braces and Invisalign run $3,000–$8,000 without insurance, which is why orthodontic benefits are among the most requested additions in open enrollment surveys.
Life and disability: Group term life at 1–2x annual salary, short-term disability and long-term disability each cost far less than medical, and pricing depends on benefit level, elimination period and workforce age. Many mid-market employers offer basic coverage as employer-paid and provide voluntary buy-up options at employee expense.
401(k) matching: A dollar-for-dollar match on the first 4% of salary — a competitive but not maximum formula — costs exactly 4% of compensation for every participating employee who contributes 4% or more. For a 200-person company with average salary of $80,000 and 80% participation, that’s approximately $512,000 per year. The vesting schedule affects when you’re actually paying it vs. when it’s accruing.
Organizations crossing the 100-participant threshold face mandatory DOL audits — employee benefit plan audit requirements and process covers the audit process and what plan sponsors need to prepare.
FSA/HSA employer contributions: Some mid-market employers make seed contributions to HSA accounts — as part of a high-deductible plan strategy. This offsets employee out-of-pocket exposure while keeping premium costs lower. The net total benefits cost is often comparable; the employer just shifts the spending from premium to HSA contribution.
Voluntary and supplemental benefits: These are typically employee-paid, but not always. Accident, critical illness, and hospital indemnity products can be offered at zero employer cost as employee-paid options. Some mid-market employers subsidize these to increase enrollment and perceived value. Employee assistance programs (EAPs), often bundled with group life or disability coverage, usually add a few free counseling sessions, which employees use for issues their health plan may not cover, such as couples therapy and marriage counseling.
Why Do Benefits Costs Per Employee Vary So Much?
Mid-market employers spent significant energy in 2023–2025 trying to hold benefits cost increases below the 6–7% annual premium inflation rate. The employers who did it successfully used specific levers — not carrier switches, which rarely produce sustained savings.
The most effective cost levers for a 100–500 employee employer:
- Plan design adjustment — moving from a $1,500 to $2,000 deductible with an employer-funded HSA contribution of $500 often reduces total employer cost (premium + HSA) by 8–12% while keeping employee out-of-pocket exposure flat. This is the lever most mid-market employers underuse because their broker defaults to keeping the plan design stable at renewal.
- Network tier strategy — adding a tiered network option (narrow network at lower employee contribution, broader network at higher cost) gives cost-conscious employees a choice without cutting coverage for those who need specialist access.
- Self-funding or level-funding — for companies with 150+ employees and stable claims history, moving off a fully insured platform to self-funding or level-funding can produce 5–15% in long-term savings. The trade-off is claims volatility in bad years; stop-loss insurance manages the catastrophic tail.
- Contribution strategy optimization — the employer/employee premium split on family tier is where the most dollars move. A company paying 70% of family premium for a $28,000 plan is paying $19,600 per family-enrolled employee per year. Adjusting to 65% saves $1,400 per family-enrolled employee — meaningful at scale, modest in individual impact.
- Benefit utilization analysis — some benefits in your program are valued highly by employees and well-utilized. Others are expensive and rarely used. An annual utilization analysis identifies where you’re spending money on benefits that don’t improve your competitive position.
How Much Does a 401(k) Match Cost Per Employee?
Health insurance dominates the benefits cost conversation, but the 401(k) match is the second-largest variable in most mid-market benefits budgets — and it’s increasingly a talent competition factor. Sequoia’s 2025 benchmarking data shows 5% of employers planning to introduce or increase matching contributions, meaning the competitive baseline is moving.
The most common mid-market match formulas and their total cost:
- 50% match on first 6% (the classic “3% effective match”) — costs 3% of compensation for employees contributing 6%+; typically the minimum competitive threshold in most industries
- Dollar-for-dollar on first 4% — costs 4% of compensation; increasingly common among mid-market tech, professional services, and financial services employers competing for knowledge workers
- Dollar-for-dollar on first 6% — costs 6% of compensation; top-quartile match for mid-market employers; competitive with enterprise-level programs in most labor markets
For a 200-person company with $80,000 average salary and 80% 401(k) participation: the 3% effective match costs approximately $384,000 per year. Moving to a 4% effective match adds $128,000 to that number. Moving to a 6% effective match adds $384,000. Whether that investment is justified depends entirely on whether your current match is limiting hiring or contributing to turnover — which is a benchmarking question.
Do Larger Companies Pay Less Per Employee for Benefits?
Everything about health insurance cost negotiation depends on your leverage with carriers — and leverage comes from size, claims history, and the volume of premium your broker places. This is the practical reason why a mid-market company working with a dedicated advisory broker gets meaningfully better rates than the same company working with a generalist.
At 100 employees, you’re in the “small large group” market. Carriers are willing to rate you competitively but have limited actuarial data on your specific claims experience. At 250 employees, you have enough claims history to be rated partially on your own experience rather than purely on manual rates. At 500 employees, you’re a meaningful account and carriers compete aggressively for the renewal.
What this means practically:
- A 100-person employer working through a broker with $300M in managed premium gets rates their 100-person enrollment alone could not access — the carrier is pricing the aggregate relationship, not just your account
- Competitive bidding — getting renewal quotes from multiple carriers — is more important at 100 employees than at 500, because your incumbent has less to lose from losing you and more pricing flexibility to recover at renewal
- The move to self-funding becomes progressively more attractive as you scale; at 500 employees you have enough data to manage the actuarial risk, and the savings from eliminating carrier profit margin and state insurance premium taxes become material
How Do You Calculate Benefits Cost Per Employee?
For CFOs building a headcount model, here’s a practical mid-market benefits cost framework that accounts for the major variables:
- Fully-loaded benefits cost per FTE: Take your annual benefits budget, divide by headcount, and compare to 25–40% of average base salary as a reasonableness check. Under 20% suggests underinsured or bare-bones benefits. Over 45% suggests either an unusually rich program or significant adverse selection in your health claims.
- New hire benefits cost for modeling: Use $12,000–$16,000 per new employee as a placeholder for health, dental, vision, life, and disability — add the 401(k) match separately as a percentage of target salary. Adjust for geography: Houston runs 10–15% below national average; New York City runs 15–20% above.
- Annual cost inflation assumption: Plan for 6–8% medical trend in your benefits budget. If your broker is promising to hold increases to 3%, ask to see the plan design assumptions behind that number — a 3% premium increase usually involves a deductible adjustment or employer contribution change that shifts cost to employees.
Illustrative Scenario: Absorb, Shift, or Restructure
A 240-employee professional-services firm faced a high-single-digit renewal increase heading into 2026 — right in line with the market trend. Rather than default to raising the deductible across the board, the CFO modeled three paths: absorb the increase and hold employee cost flat, pass ~6–7% through to employee contributions, or restructure toward a level-funded arrangement with a narrow-network option for price-sensitive employees. The restructuring path bent the effective trend by several points without gutting the benefit. The number itself wasn’t the lesson — it was that the renewal increase is a decision variable with at least three levers, not a fixed cost handed down by the carrier.
Frequently Asked Questions
How much do benefits cost per employee per year? +
Private employers spent $14.07 per hour worked on benefits in June 2026, according to the Bureau of Labor Statistics, or $17.03 per hour for full-time workers. At 2,080 hours a year, that is roughly $29,300 per employee on average and about $35,400 for a full-time employee.
Health insurance is the biggest variable. KFF’s 2025 survey puts the employer share at about $7,885 a year for single coverage and $20,143 for family coverage.
What percentage of payroll should employee benefits represent? +
BLS data for June 2026 show benefits make up 30.0% of total compensation for private industry workers, and 31.5% for full-time workers. The specific percentage depends heavily on industry (healthcare and finance tend toward the high end; retail and hospitality toward the low end), company size (larger employers generally spend more per employee in absolute terms), and geographic market. Restaurant operators managing multiple locations should see our guide to commercial umbrella insurance for restaurants.
For budgeting purposes, a mid-market employer with a competitive but not lavish program should model 30–35% of base payroll as total benefits cost — health, dental, vision, life, disability, 401(k) match, and statutory payroll taxes combined. If your number is materially below 28%, you’re likely below market on at least one major benefit line.
Is self-funding worth it for a 150-employee company? +
It depends on your workforce demographics and claims history. The primary benefits of self-funding are: you keep the underwriting profit your carrier charges in the fully insured premium, you access your own claims data, and you avoid state insurance premium taxes (2–3% of premium in most states). The primary risk is claims volatility — a bad year can spike costs significantly above what a fully insured plan would have charged.
For a 150-person company with a relatively young, healthy workforce and at least 18 months of clean claims history, self-funding with stop-loss insurance (specific and aggregate) is worth modeling seriously. Level-funded plans — a hybrid product that provides monthly cost predictability with self-funded economics — have become the most common entry point for mid-market employers at 100–200 employees. Your broker should be presenting this option at every renewal.
How much should we budget for benefits cost inflation in 2026? +
Medical trend projections for 2026 are running 6–8% for most mid-market employers on fully insured plans. Specialty pharmacy — including GLP-1 drugs — is the most significant source of upward pressure, adding 1–2% to the baseline for plans with broad GLP-1 coverage. Employers with level-funded or self-funded structures may see different trend depending on their specific claims experience.
The practical budgeting guidance: assume 7% medical trend, model plan design adjustments that reduce that to 4–5%, and use the delta as your risk reserve. A broker who tells you they can hold your increase to 3% without showing you a specific plan design change is telling you what you want to hear, not what the data supports.
How do benefits costs in Houston compare to NYC and Miami? +
Geography is a meaningful variable in health insurance pricing. Houston — and Texas generally — runs 10–15% below national average for health insurance premiums, driven by a competitive carrier market and relatively lower provider reimbursement rates compared to the Northeast. Miami and South Florida are closer to national average, with some upward pressure from higher specialist utilization rates. NYC and the New York metro area run 15–20% above national average, driven by provider costs and regulatory requirements. South Florida homeowners face some of the highest rates in the country — our Fort Lauderdale homeowners insurance guide covers what drives costs.
Companies in the Houston market exploring HR outsourcing to manage per-employee costs can review Houston PEO solutions with Chubb carrier backing for a locally anchored PEO partnership.
For a mid-market employer with offices in all three markets, this geographic variation needs to be reflected in the plan design and contribution strategy — a single plan that works at the Texas rate may be underfunded for New York. A broker with multi-market experience manages this; a single-market broker often doesn’t.
What is the most cost-effective benefits program for a 100-person company? +
Cost-effectiveness at 100 employees means getting competitive benefit quality at below-market cost — not simply the lowest possible premium. The most cost-effective structures typically combine a high-deductible health plan (HDHP) with employer HSA seed contributions, dental and vision at competitive employer-paid levels, basic life and disability as employer-paid with employee voluntary buy-up options, and a 401(k) match at the competitive floor for your industry.
The key is the benchmarking analysis that tells you what “competitive floor” means for your specific workforce and labor market. Spending above the market benchmark on benefits that employees don’t value is wasted money. Spending below the benchmark on benefits that drive retention decisions is an unquantified turnover cost. Your broker should be helping you find exactly that line — and adjusting it as your workforce and competitive environment change.
Disclaimer: Cost estimates in this article reflect mid-market benchmarking data as of 2025–2026 and are provided for planning context only. Actual costs depend on your specific plan design, workforce demographics, geography, and carrier relationships. Consult with our licensed benefits advisors for analysis specific to your organization.
Find Out Where Your Benefits Spend Stands
Hotaling Insurance Services runs independent cost benchmarking for mid-market employers managing $500K–$3M in annual benefits spend. We deliver industry-specific data matched to your company size and geography — and a concrete plan for your next renewal.
- ✓ $30.2M in managed employee benefits premium
- ✓ Multi-market expertise — Houston, Miami, NYC
- ✓ Self-funding and level-funding analysis for 100+ employee companies
- ✓ No carrier bias in our benchmarking
Serving Houston, Miami, and NYC. Minimum $1M annual premium.
About the cost figures and examples in this article: Any premium ranges, cost figures, or pricing factors discussed here are general market estimates drawn from publicly available industry data and are provided for educational context only. They are not quotes, offers, or guarantees of cost, and they do not reflect the price Hotaling Insurance Services will or can offer for any specific policy. Actual premiums are determined solely by the insurance carrier based on your individual risk profile, coverage selections, claims history, location, and other underwriting factors, and they vary widely from the general ranges described above. Any client scenarios are anonymized, illustrative composites created for educational purposes; they do not depict actual named clients and should not be relied upon as a prediction of results. Nothing in this article constitutes financial, legal, tax, or insurance advice. For pricing and coverage specific to your organization, please request a consultation with our licensed advisors.